The GBP/USD currency pair initiated a new wave of downward movement on Wednesday and Thursday. Over the past week, the trend has been mostly sideways, making it uncertain whether the pair will consolidate below the 1.2600 level. However, at the same time, we have a rebound from the moving average. It was clear and precise and could mark the starting point for another decline in the pound.
We expect a medium-term decline in the British pound, similar to the euro, driven by nearly identical reasons. This week confirmed that the market is unwilling to buy the pound even under favorable macroeconomic conditions. On Wednesday, the UK's inflation report showed stronger-than-expected growth, which could have supported the pound. However, the market largely ignored this data. This indicates that bullish factors hold little sway, with the market favoring the sale of an overbought and unjustifiably expensive pound, taking only brief pauses.
The pound has been declining for two consecutive months without any significant corrections. Earlier, it seemed that the Bank of England might slow the pound's fall by reducing rates more cautiously than the Federal Reserve. However, the Fed is nearing the end of its monetary easing cycle, spurred by Donald Trump's proposed trade wars, which could lead to higher tariffs and faster inflation. The Fed has effectively been preparing for these developments since the summer.
While the BoE may slow its rate cuts, what's the difference? The market has already priced in the Fed's easing for two years, and now it turns out that the Fed may not lower the rate as much as the market has already worked off. The market largely ignored the BoE's policy shift. The U.S. economy is also far stronger than the UK's, leaving little justification for the pound's potential growth.
Regardless of the fundamental and macroeconomic backdrop, we anticipate further declines for GBP/USD. While unexpected events such as new geopolitical conflicts, escalation of old ones, shocks in the stock and commodity markets, or economic crises could alter this trajectory, it is also impossible to say with certainty that the pound will fall for another year. However, the weekly timeframe suggests significant room for a downward movement. If the past two years' upward trend was merely a correction, the pound could eventually approach parity with the dollar in the coming years. While this seems implausible now, the pound's 16-year downward trend remains unbroken, where each new low falls below the previous one.

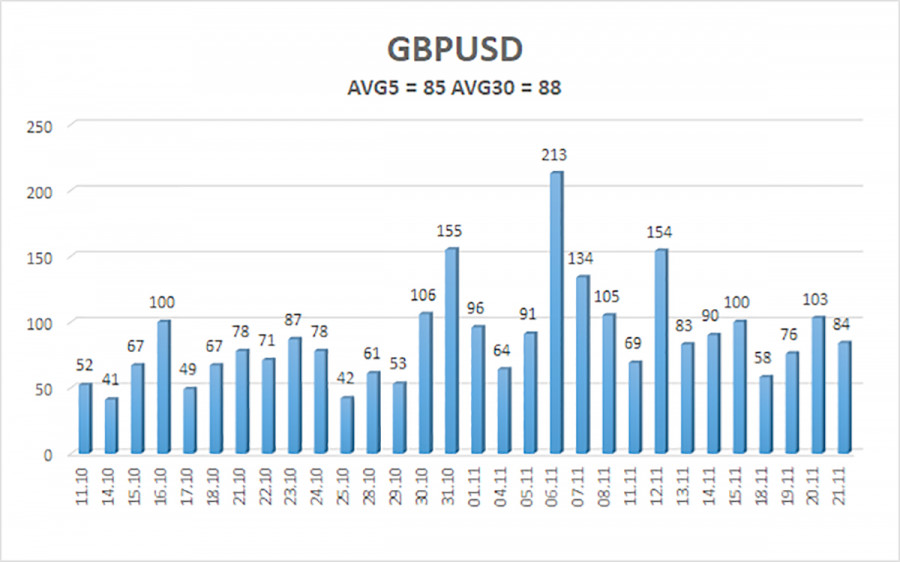
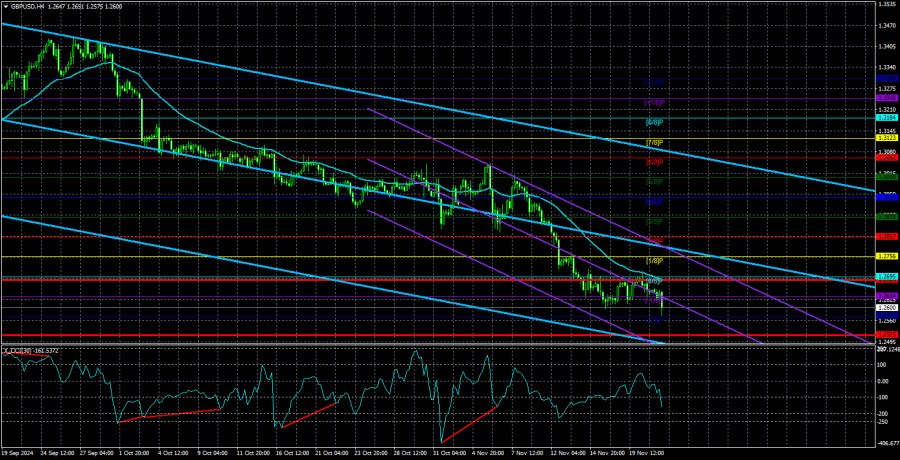
Over the last five trading days, GBP/USD has averaged 85 pips, a "moderate" level for this pair. The expected range for Friday, November 22, is between 1.2515 and 1.2685. The higher linear regression channel has turned downward, confirming the bearish trend. The CCI indicator has generated multiple bullish divergences and entered oversold territory several times, but no significant corrections have occurred.
Support Levels:
Resistance Levels:
- R1: 1.2634
- R2: 1.2695
- R3: 1.2756
Trading Recommendations:
The GBP/USD pair maintains its downward trend. We do not recommend long positions, as the factors supporting the pound's rise have already been priced in multiple times. For those trading solely on technicals, long positions may be considered above the moving average, with targets at 1.2817 and 1.2878 if the price rises above the moving average line. Short positions remain more relevant now, with targets at 1.2573 and 1.2515, as long as the price remains below the moving average.
Explanation of Illustrations:
Linear Regression Channels help determine the current trend. If both channels are aligned, it indicates a strong trend.
Moving Average Line (settings: 20,0, smoothed) defines the short-term trend and guides the trading direction.
Murray Levels act as target levels for movements and corrections.
Volatility Levels (red lines) represent the likely price range for the pair over the next 24 hours based on current volatility readings.
CCI Indicator: If it enters the oversold region (below -250) or overbought region (above +250), it signals an impending trend reversal in the opposite direction.


