empty
31.12.2024 12:45 PM
EUR/USD. December 31. The Market Prepares for the New Year

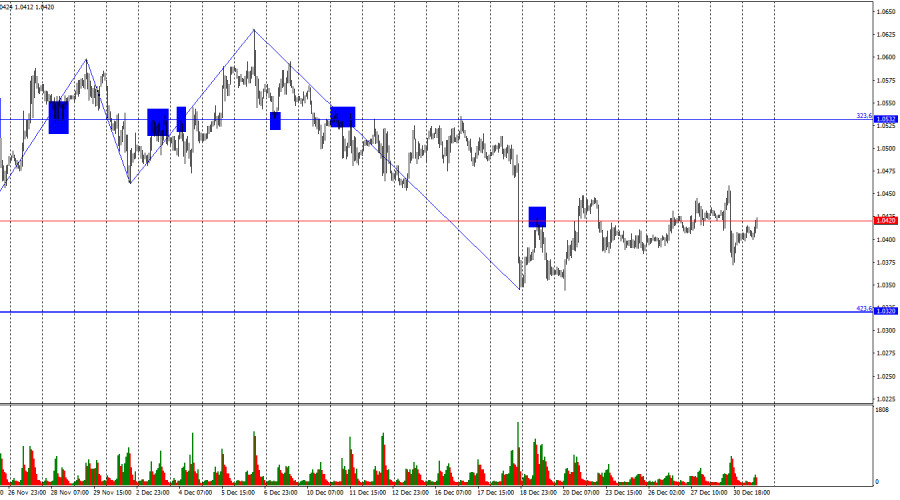
On Monday, the EUR/USD pair returned to the 1.0420 level. Despite very low trader activity, the pair is not entirely stagnant. However, even if quotes close above the 1.0420 level, I would not expect growth toward 1.0532 in the coming days. Pre-New Year activity remains too low. A rebound from the 1.0420 level could favor the US dollar, leading to a decline toward the Fibonacci level of 423.6% at 1.0320.

This image is no longer relevant

The wave situation is straightforward and clear. The last completed upward wave slightly exceeded the previous high, while the last downward wave easily broke the previous low. Thus, the formation of the "bullish" trend can be considered complete. As I expected, it turned out to be very weak. Now, a new trend is forming, and further declines in the euro are likely after the current upward wave concludes.

There was no news background on Monday. Consequently, the almost complete inactivity of bears and bulls raises no questions. The market has smoothly transitioned from Christmas celebrations to New Year's mode, so movements are likely to remain weak or absent until the end of the year. Bulls or bears may occasionally attempt to move the pair in their favor, capitalizing on the passivity of the opposing side, but predicting such movements is nearly impossible. I believe traders may continue targeting the 1.0320 level, although some patience might be required. After the holidays, the market may remain in a subdued state for several more days.

This image is no longer relevant

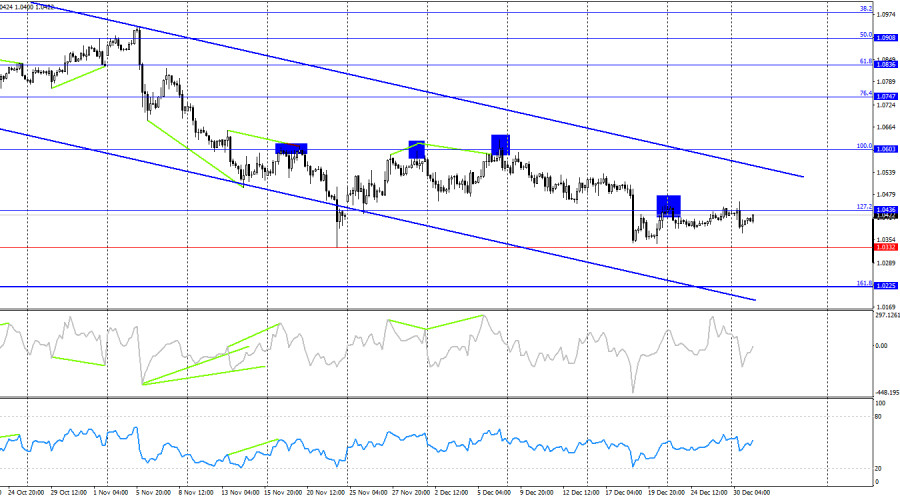
On the 4-hour chart, the pair has rebounded twice from the 100.0% retracement level at 1.0603 and later from 1.0436. Currently, another rebound from the 1.0436 level is possible. Consequently, the downtrend may resume toward the Fibonacci level of 161.8% at 1.0225. A breakout above 1.0436 would suggest potential growth toward the upper boundary of the descending trend channel. No new divergences have been observed on any indicator. The trend channel provides no reasons to anticipate strong growth for the euro.

Commitments of Traders (COT) Report:

This image is no longer relevant

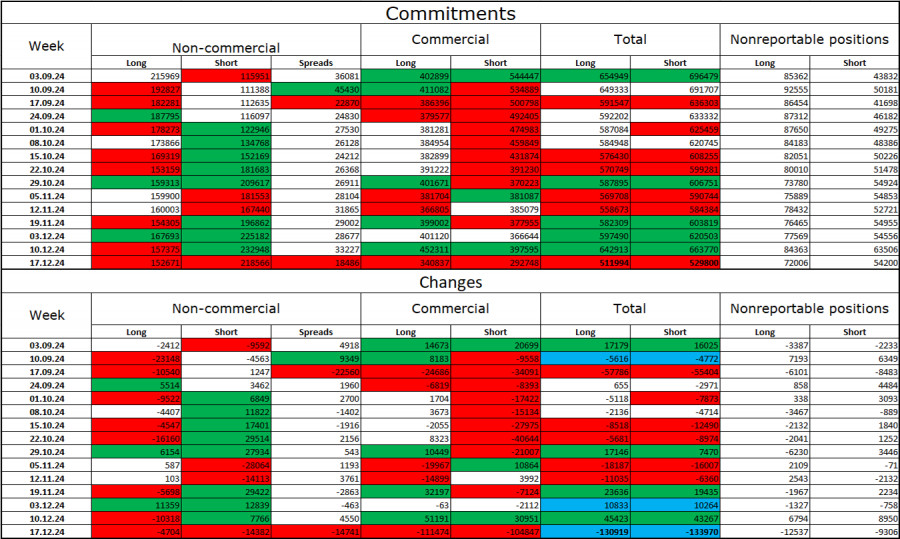
During the last reporting week, speculators closed 4,704 long positions and 14,382 short positions. The sentiment in the "Non-commercial" category remains bearish and is intensifying, indicating a further decline in the pair. The total number of long positions held by speculators is now 152,000, while short positions total 218,000.

For 14 consecutive weeks, major players have been reducing their holdings of the euro, signaling a bearish trend. Occasionally, bulls dominate in specific weeks, but these are exceptions rather than the rule. The key driver of the dollar's decline—the anticipation of a dovish FOMC monetary policy—has been priced in. There are no longer reasons for the market to offload dollars en masse. While such reasons may arise over time, a stronger dollar remains the more likely scenario. Graphical analysis also suggests a continuation of the long-term bearish trend. Therefore, I expect a prolonged decline in the EUR/USD pair.

Economic Calendar for the US and Eurozone:

The economic calendar for December 31 contains only one minor entry. The news background is unlikely to influence market sentiment today.

EUR/USD Forecast and Trading Recommendations:

Sales of the pair could have been initiated after a rebound on the 4-hour chart from the 1.0603 level, targeting 1.0420 and 1.0320. The first target has been reached, and the second is nearly achieved. New sales are possible following rebounds on the 4-hour chart from the 1.0436 level. I do not recommend considering purchases at this time.

Fibonacci Levels:

Fibonacci grids are constructed between 1.1003–1.1214 on the hourly chart and 1.0603–1.1214 on the 4-hour chart.

Samir Klishi,
ইন্সটাফরেক্সের বিশ্লেষণ বিশেষজ্ঞ
© 2007-2025
টাইমফ্রেম নির্বাচন করুন
5
মিনিট
15
মিনিট
30
মিনিট
1
ঘন্টা
4
ঘন্টা
1
দিন
1
সপ্তাহ
ইনস্টাফরেক্স দিয়ে ক্রিপ্টোমুদ্রা দর পরিবর্তনে আয় করুন।
মেটাট্রেডার 4 ডাউনলোড করে আপনার প্রথম ট্রেড চালু করুন।
  • Grand Choice
    Contest by
    InstaForex
    InstaForex always strives to help you
    fulfill your biggest dreams.
    প্রতিযোগীতায় অংশগ্রহণ করুন

সুপারিশকৃত নিবন্ধ

EUR/USD: ফেডের বৈঠকের ফলাফল এই পেয়ারের দরপতন ঘটাতে পারে

এই পেয়ারের মূল্য বর্তমানে 1.1345 রেজিস্ট্যান্স লেভেলের নিচে একটি সংকীর্ণ রেঞ্জে কনসলিডেট করছে, যেখানে ট্রেডাররা ৭ মে বুধবার শেষ হতে যাওয়া ফেডের আর্থিক নীতিমালা সংক্রান্ত বৈঠকের ফলাফলের অপেক্ষায় রয়েছে। যদি

Pati Gani 13:35 2025-05-05 UTC+2

স্বর্ণ। শিগগিরই স্বর্ণের উল্লেখযোগ্য দরপতন ঘটতে পারে

সম্প্রতি স্বর্ণের মূল্যের উল্লেখযোগ্য কারেকশন দেখা গেছে, যা মার্কেটে যুক্তরাষ্ট্র ও চীনের মধ্যে শুল্ক আরোপ এবং সামগ্রিক বাণিজ্যযুদ্ধ নিয়ে বাস্তব আলোচনার শুরুর প্রত্যাশার সাথে সঙ্গতিপূর্ণ। ট্রেজারি সেক্রেটারি বেসেন্টের বক্তব্যে তিনি

Pati Gani 10:42 2025-04-24 UTC+2

স্বর্ণ: চলমান অনিশ্চয়তা এখনও স্বর্ণের মূল্যকে সমর্থন দিয়ে যাচ্ছে

ডোনাল্ড ট্রাম্পের শুল্ক যুদ্ধ ঘিরে ভবিষ্যতের দিকনির্দেশনা নিয়ে যে অনিশ্চয়তা তৈরি হয়েছে, তার মধ্যে স্বর্ণের মূল্য এখনও সমর্থন পাচ্ছে। গত চার মাস ধরে স্বর্ণের মূল্য প্রায় বেড়েই চলেছে। এর প্রধান

Pati Gani 11:56 2025-04-17 UTC+2

স্বর্ণের (XAU/USD) ট্রেডিং সিগন্যাল, ১৬–১৮ এপ্রিল ২০২৫: মূল্য $3,320 (ওভারবট - 21 SMA) এর নিচে থাকা অবস্থায় স্বর্ণ বিক্রির সুযোগ রয়েছে

ইগল ইন্ডিকেটর বর্তমানে এক্সট্রিম ওভারবট জোনে পৌঁছেছে। তাই, বর্তমানে মূল্যের লেভেলগুলো, যা সর্বোচ্চ মূল্যের নিচে অবস্থান করছে, সেগুলো থেকে 3,281 এর দিকে যাওয়ার লক্ষ্যমাত্রা রেখে স্বর্ণ বিক্রির সুযোগ তৈরি হতে

Dimitrios Zappas 08:07 2025-04-17 UTC+2

গোল্ডের (XAU/USD) ট্রেডিং সিগন্যাল, ১৫–১৮ এপ্রিল, ২০২৫: মূল্য $3,220 (+1/8 মারি - 21 SMA) এর নিচে থাকা অবস্থায় গোল্ড বিক্রি করুন

মার্কিন সেশনের শুরুতে গোল্ড $3,220 এর আশেপাশে ট্রেড করছে এবং দুর্বলতার লক্ষণ দেখা যাচ্ছে। আগামী কয়েক ঘণ্টায় 21 SMA-র দিকে আরও একটি টেকনিক্যাল কারেকশন হওয়ার সম্ভাবনা রয়েছে। H4 চার্টে দেখা

Dimitrios Zappas 15:44 2025-04-15 UTC+2

AUD/USD পূর্বাভাস: ৯ এপ্রিল, ২০২৫

সোমবার এবং মঙ্গলবার 0.6133 লক্ষ্যমাত্রার দিকে এগোতে অস্ট্রেলিয়ান ডলারের মূল্যের যে প্রচেষ্টা পরিলক্ষিত হয়েছিল, তা থেমে যায় (যার প্রমাণ লম্বা আপার শ্যাডোগুলো)—তবে এই পেয়ারের মূল্যের লক্ষ্যমাত্রা আজও একই রয়েছে। 0.5943

Laurie Bailey 07:04 2025-04-09 UTC+2

স্বর্ণের (XAU/USD)–এর ট্রেডিং সিগন্যাল, ২৫–২৭ মার্চ, ২০২৫: মূল্য $3,024 (21 SMA - 7/8 মারে) এর ওপরে থাকা অবস্থায় স্বর্ণ কিনুন

মার্কিন সেশনের শুরুতে, স্বর্ণ $3,021 এর আশেপাশে ট্রেড করছে, যে লেভেলটি 21-SMA এর নিচে এবং ১৯ মার্চ থেকে গঠিত হওয়া বিয়ারিশ ট্রেন্ড চ্যানেলের মধ্যে অবস্থিত। H4 চার্টে আমরা দেখতে পাচ্ছি

Dimitrios Zappas 14:33 2025-03-25 UTC+2

স্বর্ণের (XAU/USD) ট্রেডিং সিগন্যাল – মার্চ ১৯-২১, ২০২৫: মূল্য $3,045 (+2/8 মারে + 21 SMA) এর নিচে থাকা অবস্থায় স্বর্ণ বিক্রির সুযোগ রয়েছে

মার্কিন সেশনের শুরুতে, গোল্ড $3,039 লেভেলের কাছাকাছি ট্রেড করছে, মূল্য +2/8 মারে লেভেলের নিচে অবস্থান করছে এবং ওভারবট লেভেলে পৌঁছেছে। প্রযুক্তিগতভাবে, স্বর্ণের তীব্র দরপতনের সম্ভাবনা রয়েছে। ইউরোপীয় সেশনে, স্বর্ণের মূল্য

Dimitrios Zappas 14:36 2025-03-19 UTC+2

স্বর্ণের (XAU/USD) ট্রেডিং সিগন্যাল, ৬-৮ মার্চ, ২০২৫: মূল্য $2,920 (21 SMA - 6/8 মারে) এর নিচে থাকা অবস্থায় স্বর্ণ বিক্রি করুন (২১ SMA - ৬/৮ মারে)

মার্কিন সেশনের শুরুতে, স্বর্ণ $2,904-এ ট্রেড করা হচ্ছি, যা ইউরোপিয়ান সেশনে 6/8 মারে ($2,889) টেস্ট করার পর পুনরুদ্ধার করেছে। আগামী কয়েক ঘণ্টার মধ্যে স্বর্ণের মূল্যের ঊর্ধ্বমুখী প্রবণতা বজায় থাকতে পারে

Dimitrios Zappas 15:06 2025-03-06 UTC+2

স্বর্ণের (XAU/USD) ট্রেডিং সিগন্যাল – ৪-৬ মার্চ, ২০২৫: মূল্য $2,908 (21 SMA - 61.8%) লেভেলের নিচে থাকা অবস্থায় স্বর্ণ বিক্রি করুন

টেকনিক্যালি, স্বর্ণের মূল্য ওভারবট লেভেলে পৌঁছেছে। তবে, আমরা ধারণা করছি যে টেকনিক্যাল কারেকশন আরও কিছু সময়ের জন্য চলতে পারে, যেখানে মূল্য $2,890 (6/8 মারে) এবং 21 SMA লেভেলের কাছাকাছি $2,880-এ

Dimitrios Zappas 07:51 2025-03-05 UTC+2
এখন কথা বলতে পারবেন না?
আপনার প্রশ্ন জিজ্ঞাসা করুন চ্যাট.
Widget callback
 

Dear visitor,

Your IP address shows that you are currently located in the USA. If you are a resident of the United States, you are prohibited from using the services of InstaFintech Group including online trading, online transfers, deposit/withdrawal of funds, etc.

If you think you are seeing this message by mistake and your location is not the US, kindly proceed to the website. Otherwise, you must leave the website in order to comply with government restrictions.

Why does your IP address show your location as the USA?

  • - you are using a VPN provided by a hosting company based in the United States;
  • - your IP does not have proper WHOIS records;
  • - an error occurred in the WHOIS geolocation database.

Please confirm whether you are a US resident or not by clicking the relevant button below. If you choose the wrong option, being a US resident, you will not be able to open an account with InstaForex anyway.

We are sorry for any inconvenience caused by this message.