Analysis of Thursday's Trades
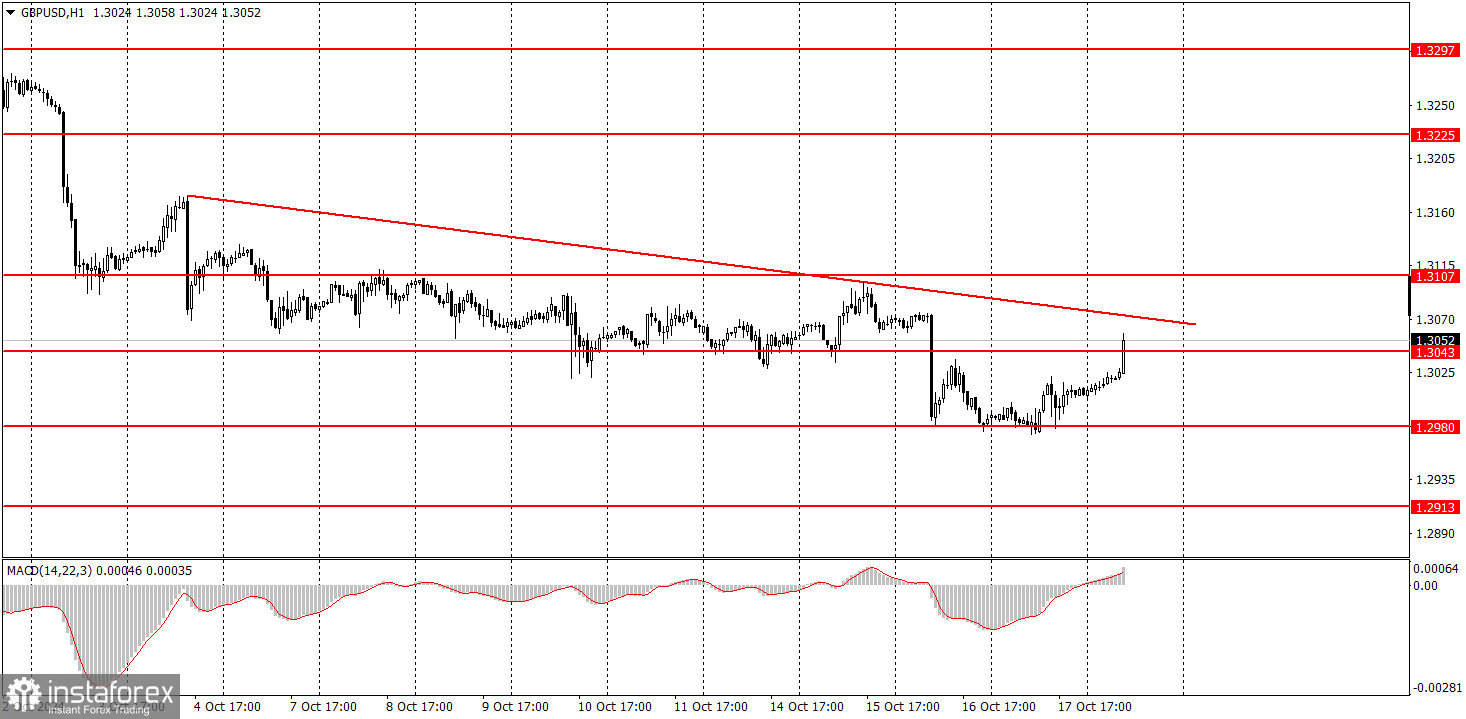
1H Chart of the GBP/USD Pair
The GBP/USD pair avoided a new decline on Thursday, but it wasn't easy. We had warned that the 1.3000 level is a psychological level that would be difficult to overcome on the first attempt. Ultimately, this level prevented the British currency from another fall. However, even considering yesterday's and today's growth in the pair, it's still too early to say that a correction has started. The price has yet to settle above the trend line, and it's far from certain that it will be able to do so today.
In the UK, a September retail sales report was published today, which turned out stronger than expected. Thus, the market had reasons to buy. The question is how long these purchases will last. A price rebound from the trend line could trigger a new wave of selling in the British pound, which, in our view, would be entirely justified. If the trend line is breached, a correction may begin.
5M Chart of the GBP/USD Pair
Two trading signals were formed around the 1.2980-1.2993 area in the 5-minute time frame on Thursday. In both cases, the price moved up no more than 25 pips. Volatility remains very low. Since the intraday movements are extremely weak, it was possible to remain in buy positions from yesterday. Today, the pound was supported by the UK retail sales report, but it was impossible to predict its outcome in advance. Therefore, a renewed decline in the pound could have been just as likely.
How to Trade on Friday:
In the hourly time frame, the GBP/USD pair broke the upward trend and continued its decline. The U.S. dollar has begun its long-awaited rise, but caution should be exercised with selling, as the pair has not even attempted a correction in the past three weeks. There are no indications that the price is preparing for a correction. We fully support the pair's decline in the medium-term outlook, as we believe this is the only logical outcome.
On Friday, the pair may well resume its downward movement. As long as the price has not breached the trend line, there is no point in considering buying. Even if it does, it would only signify a correction.
On the 5-minute time frame, you can trade around the levels of 1.2848-1.2860, 1.2913, 1.2980-1.2993, 1.3043, 1.3102-1.3107, 1.3145-1.3167, 1.3225, 1.3272, 1.3365, 1.3428-1.3440. On Friday, the only scheduled report in the UK has already been published, and in the U.S., data on building permits and new housing will be released in the afternoon. We consider these reports to be of secondary importance.
Basic Rules of the Trading System:
- The strength of a signal is determined by the time it takes to form (bounce or break through a level). The less time it takes, the stronger the signal.
- If two or more trades were opened near a particular level based on false signals, all subsequent signals from that level should be ignored.
- In a flat market, any pair can generate a lot of false signals or none at all. In any case, it's best to stop trading at the first signs of a flat market.
- Trades should be opened during the period between the start of the European session and the middle of the US session, after which all trades should be manually closed.
- In the hourly time frame, it's preferable to trade based on MACD signals only when there is good volatility and a trend confirmed by a trendline or trend channel.
- If two levels are very close to each other (between 5 and 20 pips), they should be treated as a support or resistance zone.
- When moving 20 pips in the intended direction, a Stop Loss should be set to breakeven.
What's on the Charts:
Support and Resistance Price Levels: These levels serve as targets when opening buy or sell positions. They can also be used as points to set Take Profit levels.
Red Lines: These represent channels or trend lines that display the current trend and indicate the preferred trading direction.
MACD Indicator (14,22,3): The histogram and signal line serve as an auxiliary indicator that can also be used as a source of trading signals.
Important Speeches and Reports (always found in the news calendar) can significantly impact the movement of a currency pair. Therefore, trading should be done with maximum caution during their release, or you may choose to exit the market to avoid a sharp price reversal against the preceding movement.
For Beginners Trading on the Forex Market: It's essential to remember that not every trade will be profitable. Developing a clear strategy and practicing money management is key to achieving long-term success in trading.