empty
21.11.2024 08:13 AM
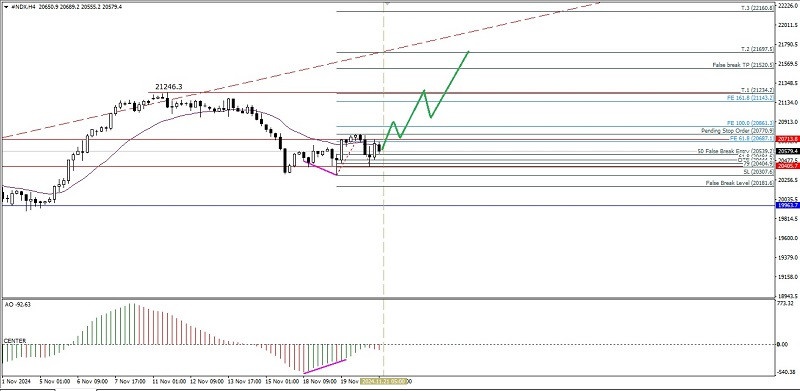
Technical Analysis of Intraday Price Movement of Nasdaq 100 Index, November 21, 2024.

This image is no longer relevant

With the appearance of deviations between the Nasdaq 100 index price movement and the Awesome Oscillator indicator on the 4-hour chart, it gives an indication and confirmation that in the near future #NDX has the potential to strengthen upwards to the level of 20770.9 where if this level is successfully broken and #NDX successfully closes above that level then in the near future as long as there is no further weakening correction that breaks and closes below the level of 20307.6 the Nasdaq 100 index has the potential to strengthen to the level of 21246.3 as its main target and if the momentum and volatility support it then #NDX will continue to strengthen again to the level of 21697.5.

(Disclaimer)

Select timeframe
5
min
15
min
30
min
1
hour
4
hours
1
day
1
week
Earn on cryptocurrency rate changes with InstaForex
Download MetaTrader 4 and open your first trade
  • Grand Choice
    Contest by
    InstaForex
    InstaForex always strives to help you
    fulfill your biggest dreams.
    JOIN CONTEST

Recommended Stories

EUR/USD – February 20th: FOMC Concerns Over Trump's Policies

On Wednesday, EUR/USD continued its downward movement, reaching the 61.8% Fibonacci retracement level at 1.0411. A rebound from this level would favor the euro's recovery towards 1.0458 and 1.0533. Conversely

Samir Klishi 10:45 2025-02-20 UTC+2

GBP/USD – February 20th: UK Inflation Fails to Support Bulls

On the hourly chart, GBP/USD rebounded for the third consecutive time from the 1.2611–1.2620 resistance zone, experiencing a slight decline toward the 61.8% Fibonacci retracement level at 1.2538. Today

Samir Klishi 10:42 2025-02-20 UTC+2

Forex forecast 20/02/2025: EUR/USD, USD/JPY, USD/CAD, Oil and Bitcoin

Useful links: My other articles are available in this section InstaForex course for beginners Popular Analytics Open trading account Important: The begginers in forex trading need to be very careful

Sebastian Seliga 10:32 2025-02-20 UTC+2

Technical Analysis of Intraday Price Movement of Hang Seng Index, Thursday February 20, 2025.

On the 4-hour chart of the Hang Seng index, there are 3 interesting things, first the appearance of Divergence between the price movement of the index and the Stochastic Oscillator

Arief Makmur 06:12 2025-02-20 UTC+2

Technical Analysis of Intraday Price Movement of Nasdaq 100 Index, Thursday February 20, 2025.

If we look at the 4-hour chart of the Nasdaq 100 index, we will see a Divergence between the price movement of #NDX and the Stochastic Oscillator indicator (5,3,3), especially

Arief Makmur 06:12 2025-02-20 UTC+2

EUR/USD Forecast for February 20, 2025

Yesterday, the euro declined by 22 pips; however, a daily close below key levels was prevented by the balance indicator line on the daily timeframe and the MACD line

Laurie Bailey 03:56 2025-02-20 UTC+2

GBP/USD Forecast for February 20, 2025

The pound sterling experienced a rough day yesterday, but it showed growth at the start of today's session. If the price breaks above the key resistance level at 1.2616

Laurie Bailey 03:56 2025-02-20 UTC+2

USD/JPY Forecast for February 20, 2025

In the weekly timeframe, the current candle opened below the MACD line, and by Friday evening, it is highly likely that it will close and consolidate below this line

Laurie Bailey 03:56 2025-02-20 UTC+2

USD/CAD Forecast for February 20, 2025

A week ago, on February 14, the Canadian dollar reached the support of the embedded line within the green ascending channel on the weekly timeframe and subsequently rebounded. Together with

Laurie Bailey 03:56 2025-02-20 UTC+2

GBP/CHF Forecast for February 20, 2025

After testing the target level of 1.1411, which marked the highs of March and April 2023, GBP/CHF has reversed downward, forming a divergence with the daily Marlin oscillator. The price

Laurie Bailey 03:56 2025-02-20 UTC+2
Can't speak right now?
Ask your question in the chat.
Widget callback