empty
02.04.2025 08:04 PM
EUR/USD: Trading Plan for the U.S. Session on April 2nd (Review of Morning Trades)

In my morning forecast, I highlighted the 1.0781 level and planned to make trading decisions based on it. Let's look at the 5-minute chart and break down what happened. A decline and the formation of a false breakout at that level provided a good entry point for long positions, which resulted in a 30-point rise in the euro. The technical picture has not been revised for the second half of the day.

This image is no longer relevant

To open long positions on EUR/USD:

Given the lack of statistical data, relatively active buying around 1.0781—the previous day's low—was fairly expected. However, things may change in the second half of the day. We're expecting U.S. ADP employment change data and factory orders. The speech by FOMC member Adriana D. Kugler is unlikely to attract much attention, as the market focus will be on Trump's speech and the announcement of reciprocal tariffs, for which no details have been provided yet. Only a softer tariff format could help risk assets recover.

If the euro falls after the data releases, only a false breakout near the 1.0781 support area will provide a reason to buy EUR/USD in anticipation of a bullish rebound with a target of 1.0813. A breakout and retest from above would confirm the correct entry point, opening the path to 1.0848. The ultimate target will be the 1.0884 area, where I will take profits.

If EUR/USD declines and there is no activity around 1.0781, pressure on the euro will increase sharply. In that case, sellers could push the pair to 1.0757. Only after a false breakout there will I consider buying the euro. I plan to buy immediately on a rebound from 1.0736 for an intraday correction of 30–35 points.

To open short positions on EUR/USD:

Sellers are still waiting, and only more aggressive tariffs from Trump can bring new players into the market betting on a stronger dollar. In case of a negative reaction to the ADP data, only a false breakout near the 1.0813 resistance will allow for short positions, aiming for another decline toward 1.0781 support.

A breakout and consolidation below this range will be a solid sell signal with a move toward 1.0757. The final target will be the 1.0736 area, where I will take profits.

If EUR/USD rises in the second half of the day after the data and Trump's speech, and bears are inactive near 1.0813—where moving averages are located—buyers could push the pair higher. In this case, I'll delay shorts until the next resistance at 1.0845, selling only after a failed breakout. If no downward movement happens there either, I'll look for shorts on a rebound from 1.0916, targeting a 30–35 point correction.

This image is no longer relevant

Commitment of Traders (COT) Report:

The March 25 COT report showed a modest increase in long positions and a significant reduction in shorts. There's no noticeable increase in euro buyers, but sellers are clearly retreating. Considering recent inflation data in the eurozone and ECB officials' comments, the regulator's stance at the upcoming April meeting will likely remain unchanged, which could temporarily support the euro.

However, much will depend on the impact of U.S. tariffs on other countries. The more serious the threat to global economic growth, the greater the pressure on risk assets, including the euro.

According to the COT report, long non-commercial positions rose by 844 to 189,796, while short non-commercial positions dropped by 5,256 to 124,271. The gap between long and short positions increased by 3,855.

This image is no longer relevant

Indicator Signals:

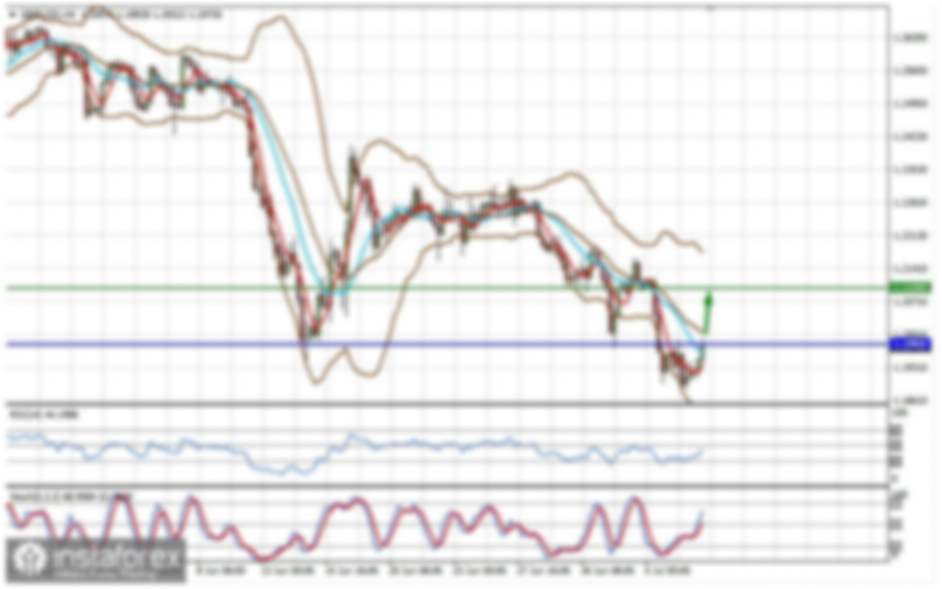
Moving Averages: Trading is around the 30- and 50-period moving averages, indicating a sideways market.

Note: The period and prices of moving averages are based on the H1 chart and may differ from the classic daily moving averages on the D1 chart.

Bollinger Bands: In case of a decline, the lower boundary of the indicator near 1.0781 will act as support.

Indicator Descriptions:

  • Moving Average: Smooths volatility and noise to define the current trend. Period 50 (yellow), Period 30 (green).
  • MACD (Moving Average Convergence/Divergence): Fast EMA – 12, Slow EMA – 26, Signal SMA – 9.
  • Bollinger Bands: Period – 20.
  • Non-commercial traders: Speculators such as individual traders, hedge funds, and large institutions using the futures market for speculative purposes under specific requirements.
  • Long non-commercial positions: Total long open positions held by non-commercial traders.
  • Short non-commercial positions: Total short open positions held by non-commercial traders.
  • Total non-commercial net position: The difference between short and long non-commercial positions.
Miroslaw Bawulski,
Analytical expert of InstaForex
© 2007-2025
EURUSD
Euro vs US Dollar
Summary
Sell
Urgency
1 day
Analytic
Maxim Magdalinin
Start trade
Earn on cryptocurrency rate changes with InstaForex
Download MetaTrader 4 and open your first trade
  • Grand Choice
    Contest by
    InstaForex
    InstaForex always strives to help you
    fulfill your biggest dreams.
    JOIN CONTEST

Recommended Stories

GBP/USD: Trading Plan for the U.S. Session on July 7th (Review of Morning Trades)

In my morning forecast, I highlighted the 1.3602 level and planned to use it to determine entry points into the market. Let's look at the 5-minute chart and analyze what

Miroslaw Bawulski 13:21 2025-07-07 UTC+2

EUR/USD: Trading Plan for the U.S. Session on July 7th (Review of the Morning Trades)

In my morning forecast, I highlighted the 1.1749 level and planned to base market entry decisions around it. Let's look at the 5-minute chart and break down what happened

Miroslaw Bawulski 13:20 2025-07-07 UTC+2

How to Trade the GBP/USD Currency Pair on July 7th? Simple Tips and Trade Review for Beginners

On Friday, the GBP/USD pair showed total flat movement and low volatility. As with the EUR/USD pair, there was no news that day, and no macroeconomic publications were released either

Paolo Greco 07:48 2025-07-07 UTC+2

How to Trade the EUR/USD Currency Pair on July 7th: Simple Tips and Trade Analysis for Beginners

Friday Trade Analysis: EUR/USD 1H Chart The EUR/USD pair stayed flat all day Friday, with volatility totaling 36 points, clearly indicating a lack of trading activity. This is not surprising

Paolo Greco 07:32 2025-07-07 UTC+2

GBP/USD Trading Recommendations and Trade Analysis for July 7th

The GBP/USD currency pair traded with low volatility and primarily moved sideways. As mentioned earlier, last week was particularly interesting in how the market interpreted various events and publications

Paolo Greco 07:11 2025-07-07 UTC+2

EUR/USD Trading Recommendations and Trade Analysis for July 7th

The EUR/USD currency pair did not exhibit any notable movements on Friday—or any movements at all. Friday was Independence Day in the United States, effectively making it a non-trading

Paolo Greco 07:03 2025-07-07 UTC+2

GBP/USD: Trading Plan for the U.S. Session on July 4th (Review of Morning Trades)

In my morning forecast, I highlighted the 1.3672 level as a key decision point for entering the market. Let's look at the 5-minute chart and analyze what happened. A rise

Miroslaw Bawulski 18:20 2025-07-04 UTC+2

EUR/USD: Trading Plan for the U.S. Session on July 4th (Review of Morning Trades)

In my morning forecast, I highlighted the 1.1787 level as a key point for making trading decisions. Let's look at the 5-minute chart to analyze what happened. A rise

Miroslaw Bawulski 18:16 2025-07-04 UTC+2

How to Trade the GBP/USD Pair on July 4? Simple Tips and Trade Analysis for Beginners

Analysis of Thursday's Trades 1H Chart of GBP/USD On Thursday, the GBP/USD pair once again plummeted, but this time the drop in the British currency lasted only five minutes

Paolo Greco 07:16 2025-07-04 UTC+2

How to Trade the EUR/USD Pair on July 4? Simple Tips and Trade Analysis for Beginners

Analysis of Thursday's Trades 1H Chart of EUR/USD The EUR/USD currency pair traded throughout Thursday, both before and after the publication of the U.S. Nonfarm Payrolls and unemployment data

Paolo Greco 06:34 2025-07-04 UTC+2
Can't speak right now?
Ask your question in the chat.
Widget callback
 

Dear visitor,

Your IP address shows that you are currently located in the USA. If you are a resident of the United States, you are prohibited from using the services of InstaFintech Group including online trading, online transfers, deposit/withdrawal of funds, etc.

If you think you are seeing this message by mistake and your location is not the US, kindly proceed to the website. Otherwise, you must leave the website in order to comply with government restrictions.

Why does your IP address show your location as the USA?

  • - you are using a VPN provided by a hosting company based in the United States;
  • - your IP does not have proper WHOIS records;
  • - an error occurred in the WHOIS geolocation database.

Please confirm whether you are a US resident or not by clicking the relevant button below. If you choose the wrong option, being a US resident, you will not be able to open an account with InstaForex anyway.

We are sorry for any inconvenience caused by this message.