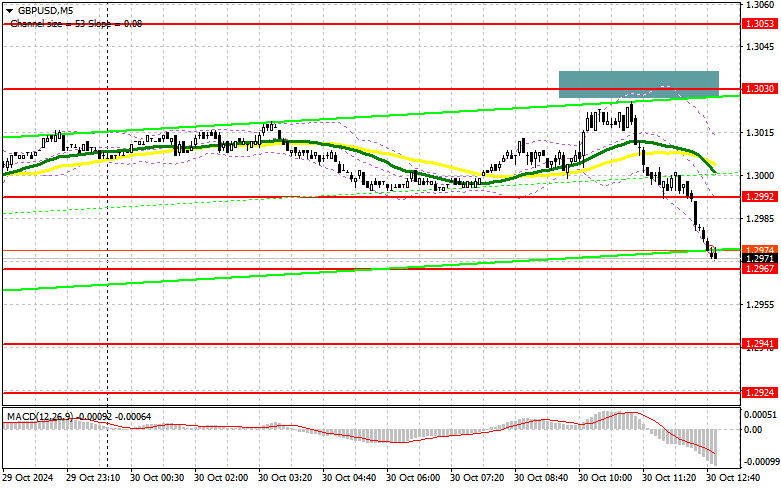
In my morning forecast, I highlighted the 1.3030 level as a decision point for market entry. Let's look at the 5-minute chart to see what happened. Although the price rose, it fell just a couple of points short of testing 1.3030, so I couldn't secure a suitable entry point for a sale. The technical outlook has been slightly adjusted for the second half of the day.
To Open Long Positions on GBP/USD:
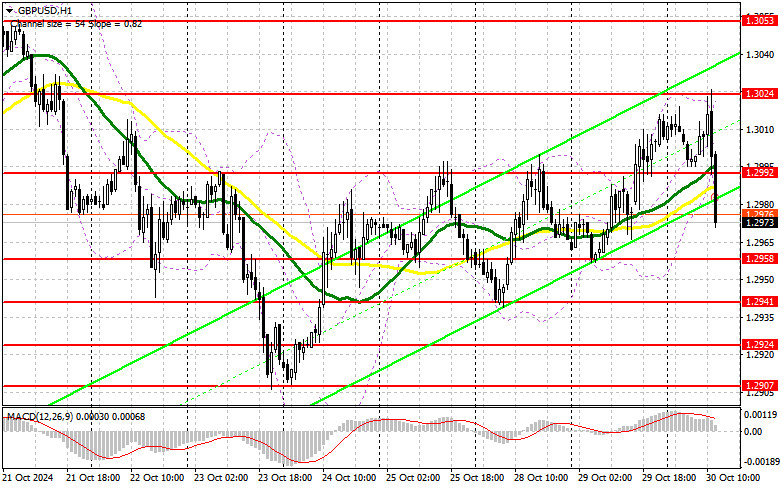
The pound has sharply declined after reaching the daily high, relying on U.S. data for any potential reversal. Only weak U.S. GDP and ADP employment reports will prompt the pound's rise. Otherwise, pressure on the pair will likely increase, opening the way to around 1.2958, where I plan to act. A false breakout formation here would confirm a suitable entry point for long positions, aiming for a recovery toward 1.2992. A breakout and retest of 1.2992 would present a new entry for long positions, with prospects of reaching 1.3024, the next resistance level. The furthest target would be 1.3053, where I plan to take profit. In the event of a GBP/USD decline with no buyer activity around 1.2958 in the afternoon, a bearish market return is likely, leading to a fall and further support test at 1.2941. Only a false breakout here would confirm a good entry for longs. I plan to buy GBP/USD on an immediate rebound from the 1.2924 low, aiming for a 30-35 point correction within the day.
To Open Short Positions on GBP/USD:
Sellers are actively engaging following the Treasury's rather discouraging forecasts for the UK. Additional pressure could come from U.S. statistics, so it's wise to be cautious with purchases. If the pair rises on the data release, sellers will likely engage around the closest resistance at 1.2992, where moving averages also support their stance. A false breakout formation here would provide a suitable selling point, aiming for a decline toward support at 1.2958, keeping the pair within the sideways range. A breakout and retest from below would strike a blow to buyers, triggering stop orders and opening the way to 1.2941. The furthest target would be 1.2924, where I plan to take profit. Testing this level would reinforce the bearish market. If GBP/USD rises without bearish activity at 1.2992 amid weak U.S. data, buyers may continue to push forward, prompting sellers to retreat toward the 1.3024 resistance. I'll consider selling there only on a false breakout. If there's no downward movement, I'll look to open short positions on a rebound from 1.3053, expecting a 30-35 point downward correction within the day.

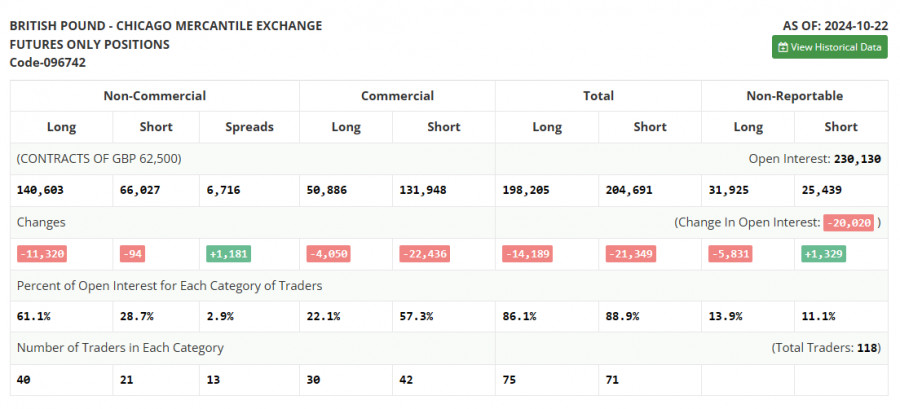
The COT report (Commitment of Traders), as of October 22, showed reductions in both long and short positions. However, the decline in buyer positions didn't greatly affect market dynamics, as buyers still outnumber sellers by nearly 2.5 times. This week lacks significant UK statistics, and with British policymakers having said all they can, I expect further pound recovery against the dollar. However, much depends on the U.S. GDP and labor market data, so these indicators shouldn't be overlooked. The latest COT report shows a drop in long non-commercial positions by 11,320 to 140,603, while short non-commercial positions decreased by just 94 to 66,072, widening the gap by 1,181.
Indicator Signals:
Moving Averages:
Trading is below the 30- and 50-day moving averages, suggesting further pair decline.
Note: The moving average periods and prices are analyzed by the author on the H1 hourly chart, differing from the classic daily moving averages on the D1 daily chart.
Bollinger Bands:
If the pair declines, the lower boundary of the indicator around 1.2992 will act as support.
Indicator Descriptions:
- Moving Average: Defines the current trend by smoothing volatility and noise. Period Ц 50 (marked in yellow).
- Moving Average: Defines the current trend by smoothing volatility and noise. Period Ц 30 (marked in green).
- MACD Indicator: (Moving Average Convergence/Divergence Ц fast EMA period 12, slow EMA period 26, SMA period 9).
- Bollinger Bands: Period Ц 20.
- Speculative Traders: Includes individual traders, hedge funds, and large institutions using the futures market for trading purposes.
- Long Non-Commercial Positions: Represents the total open long position of speculative traders.
- Short Non-Commercial Positions: Represents the total open short position of speculative traders.
- Net Non-Commercial Position: The difference between short and long positions of speculative traders.


