empty
29.01.2025 01:14 PM
Forecast for EUR/USD on January 29, 2025

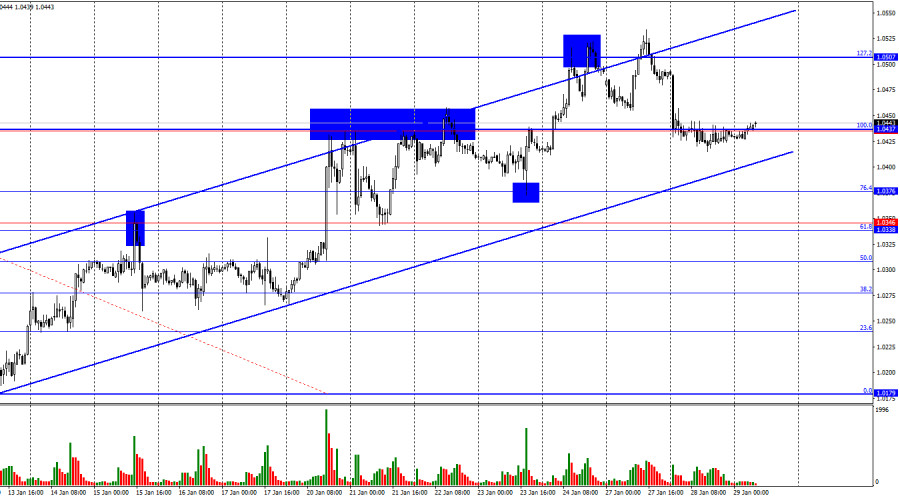
On Tuesday, EUR/USD continued to decline after rebounding from the 127.2% Fibonacci retracement level at 1.0507 and reached the 100.0% Fibonacci level at 1.0437. Since no rebound occurred at this level, the decline may continue today. A break below the upward trend channel would be the first sign of a shift to a bearish trend. In this case, I expect a strong and prolonged decline in the euro.

This image is no longer relevant

The wave structure remains clear. The last completed downward wave broke below the previous wave's low, while the last (still unfinished) upward wave has surpassed the previous two peaks. Thus, the bearish trend is considered completed. However, the recent waves have been very small. The current upward wave can be easily broken down into 5-6 smaller waves. The key issue here is determining which movement size qualifies as a wave. Since the situation is not entirely straightforward, it is best to rely on the trend channel for guidance.

On Tuesday, the news background was limited. The US durable goods orders report showed a 2.2% decline, while traders expected a 0.6% increase. Derivative indicators also came in weaker than forecasts. This presented bulls with an opportunity to push higher within the current bullish trend. However, they preferred to wait for the outcome of the FOMC meeting.

The Fed meeting is always a crucial event for the market, even if no changes to monetary policy are expected. Right after the decision, Fed Chair Jerome Powell will speak, and the content of his speech is unpredictable. Therefore, surprises are always possible, and today is no exception. Traders' reluctance to take risks before such an event is understandable. Moreover, Donald Trump's influence is a major factor affecting market sentiment—and potentially the Fed's stance as well.

This image is no longer relevant

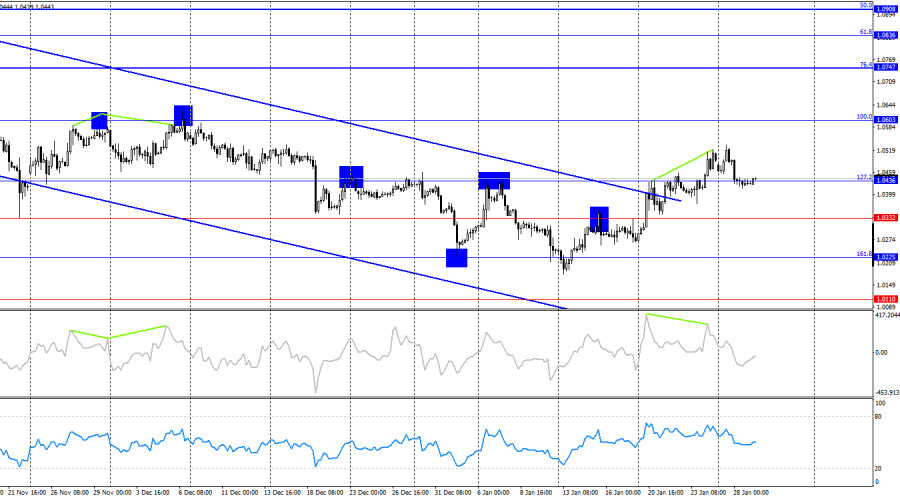
On the 4-hour chart, the pair broke above the 127.2% Fibonacci retracement level at 1.0436. This suggests that the uptrend may continue toward the 100.0% Fibonacci level at 1.0603, while the euro has now broken out of the downward trend channel. This signals a potential trend reversal to bullish, but how long will this trend last?

A bearish divergence on the CCI indicator points to a possible decline in the near future, but bears have yet to secure a close below 1.0436.

Commitments of Traders (COT) Report

This image is no longer relevant

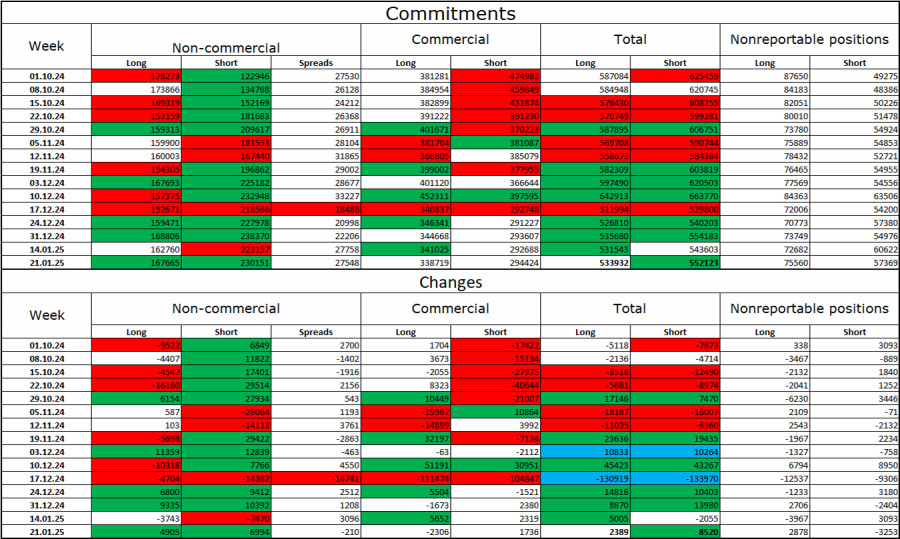
Over the last reporting week, institutional traders added 4,905 long positions and 6,994 short positions. The Non-commercial category remains bearish, suggesting further downside for the pair. The total number of long positions held by speculators is now 167,000, while short positions stand at 230,000.

For 18 consecutive weeks, major traders have been selling the euro. This confirms a bearish trend with no exceptions. Occasionally, bulls dominate on a weekly basis, but this remains anomalous.

The key driver of the dollar's decline—expectations of Fed monetary policy easing—has already been priced in. The market no longer has reasons to sell the dollar. New factors may emerge over time, but for now, further appreciation of the US dollar remains the most likely scenario. Technical analysis also supports a continuation of the long-term bearish trend, which leads me to expect a further decline in EUR/USD.

Economic Calendar for the US and the Eurozone

  • Eurozone – German Consumer Confidence Index (07:00 UTC)
  • US – FOMC Interest Rate Decision (19:00 UTC)
  • US – FOMC Press Conference (19:30 UTC)

On January 29, the economic calendar includes two major Fed-related events. Market sentiment may be strongly influenced by the news flow, but likely only in the evening.

EUR/USD Forecast and Trading Recommendations

  • Selling EUR/USD is advisable after a confirmed break below the ascending trend corridor on the hourly chart.
  • Buying is possible today if the pair rebounds from the lower boundary of the ascending trend corridor, targeting 1.0507.
  • However, trader activity is expected to surge in the evening, leading to potentially volatile and unpredictable movements.

Fibonacci levels:

  • Hourly chart: 1.0437–1.0179
  • 4-hour chart: 1.0603–1.1214
Samir Klishi,
Analytical expert of InstaForex
© 2007-2025
Select timeframe
5
min
15
min
30
min
1
hour
4
hours
1
day
1
week
Earn on cryptocurrency rate changes with InstaForex
Download MetaTrader 4 and open your first trade
  • Grand Choice
    Contest by
    InstaForex
    InstaForex always strives to help you
    fulfill your biggest dreams.
    JOIN CONTEST

Recommended Stories

Technical Analysis of Intraday Price Movement of EUR/USD Main Currency Pairs, Tuesday February 18, 2025.

On the 4-hour chart, the main currency pair EUR/USD appears to have a Divergence between the Fiber price movement and the MACD Histogram indicator (12,26,9). This confirms that

Arief Makmur 07:17 2025-02-18 UTC+2

Technical Analysis of Intraday Price Movement of XPD/USD Commodity Instrument, Tuesday February 18, 2025.

With the condition of the Stochastic Oscillator indicator which is still Crossing SELL and also confirmed by the movement of the XPD / USD price below EMA 21 which indicates

Arief Makmur 07:17 2025-02-18 UTC+2

USD/JPY Forecast for February 18, 2025

The USD/JPY currency pair has reached a support level at 151.30 and is starting to reverse upward from this point. The Marlin oscillator indicates a bullish trend, showing signs

Laurie Bailey 04:46 2025-02-18 UTC+2

GBP/USD Forecast for February 18, 2025

The British pound has corrected by 38.2% of the entire movement since August 26 of last year, reaching the target level of 1.2616. The daily Marlin oscillator is declining

Laurie Bailey 04:46 2025-02-18 UTC+2

EUR/USD Forecast for February 18, 2025

Over the past two sessions, the euro has been consolidating above the 1.0458 level, indicating signs of divergence with the Marlin oscillator. This pattern highlights two key market characteristics

Laurie Bailey 04:46 2025-02-18 UTC+2

Trading Signals for EUR/USD for February 17-19, 2025: sell below 1.0500 (21 SMA - 6/8 Murray)

In case EUR/USD consolidates above 1.0498, it could extend its bullish movement and reach the top of the bullish trend channel around 1.0535. In case EUR/USD breaks this zone

Dimitrios Zappas 15:49 2025-02-17 UTC+2

Trading Signals for BITCOIN (BTC/USD) for February 17-19, 2025: buy above $ 97,000 (21 SMA - 200 EMA)

A consolidation above 97,500 could favor the recovery of Bitcoin. We could expect it to reach the 200 EMA located around 98,591 and it could finally test the psychological level

Dimitrios Zappas 15:47 2025-02-17 UTC+2

Trading Signals for GOLD (XAU/USD) for February 17-19, 2025: buy above $2,908 (21 SMA - 5/8 Murray)

Early in the American session, gold is trading around 2,898 within the bullish trend channel forming since February 20, below the 21 SMA, and above the 5/8 Murray. Gold maintains

Dimitrios Zappas 15:45 2025-02-17 UTC+2

EUR/USD – February 17th. Traders Are Hesitant at the Start of the New Week

On Friday, the EUR/USD pair consolidated above the 76.4% Fibonacci retracement level at 1.0458, continuing its upward movement toward the next retracement level at 1.0533. This trend may continue into

Samir Klishi 12:39 2025-02-17 UTC+2

GBP/USD – February 17th. Has the British Pound Reached Its Limit?

On the hourly chart, GBP/USD continued its upward movement on Friday, closing near the resistance zone of 1.2611–1.2620. A rejection from this zone may lead to a reversal in favor

Samir Klishi 12:34 2025-02-17 UTC+2
Can't speak right now?
Ask your question in the chat.
Widget callback
 

Dear visitor,

Your IP address shows that you are currently located in the USA. If you are a resident of the United States, you are prohibited from using the services of InstaFintech Group including online trading, online transfers, deposit/withdrawal of funds, etc.

If you think you are seeing this message by mistake and your location is not the US, kindly proceed to the website. Otherwise, you must leave the website in order to comply with government restrictions.

Why does your IP address show your location as the USA?

  • - you are using a VPN provided by a hosting company based in the United States;
  • - your IP does not have proper WHOIS records;
  • - an error occurred in the WHOIS geolocation database.

Please confirm whether you are a US resident or not by clicking the relevant button below. If you choose the wrong option, being a US resident, you will not be able to open an account with InstaForex anyway.

We are sorry for any inconvenience caused by this message.