Pola sebenarnya
Patterns are graphical models which are formed in the chart by the price. According to one of the technical analysis postulates, history (price movement) repeats itself. It means that the price movements are often similar in the same situations which makes it possible to predict the further development of the situation with a high probability.
Actual Patterns
- All
- Double Top
- Flag
- Head and Shoulders
- Pennant
- Rectangle
- Triangle
- Triple top
- All
- #AAPL
- #AMZN
- #Bitcoin
- #EBAY
- #FB
- #GOOG
- #INTC
- #KO
- #MA
- #MCD
- #MSFT
- #NTDOY
- #PEP
- #TSLA
- #TWTR
- AUDCAD
- AUDCHF
- AUDJPY
- AUDUSD
- EURCAD
- EURCHF
- EURGBP
- EURJPY
- EURNZD
- EURRUB
- EURUSD
- GBPAUD
- GBPCHF
- GBPJPY
- GBPUSD
- GOLD
- NZDCAD
- NZDCHF
- NZDJPY
- NZDUSD
- SILVER
- USDCAD
- USDCHF
- USDJPY
- USDRUB
- All
- M5
- M15
- M30
- H1
- D1
- All
- Buy
- Sale
- All
- 1
- 2
- 3
- 4
- 5

According to the chart of M5, NZDCHF formed the Bullish Rectangle. The pattern indicates a trend continuation. The upper border is 0.4754, the lower border is 0.4746. The signal means
The M5 and M15 time frames may have more false entry points.
Open chart in a new window
According to the chart of M5, USDCAD formed the Bearish Rectangle which is a pattern of a trend continuation. The pattern is contained within the following borders: lower border 1.3871
The M5 and M15 time frames may have more false entry points.
Open chart in a new window
On the chart of #Bitcoin M5 the Double Top reversal pattern has been formed. Characteristics: the upper boundary 83924.61; the lower boundary 83599.60; the width of the pattern 32501 points
The M5 and M15 time frames may have more false entry points.
Open chart in a new window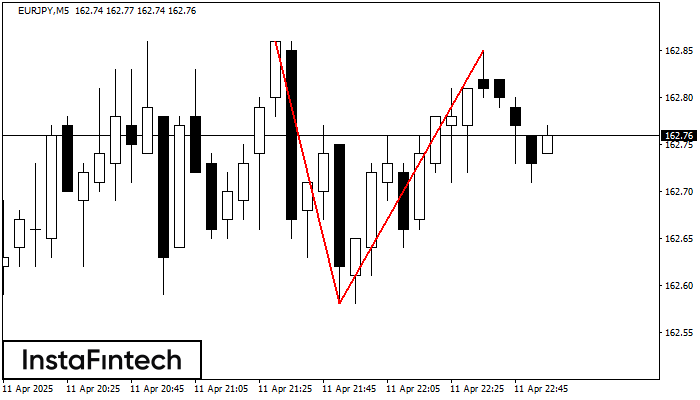
On the chart of EURJPY M5 the Double Top reversal pattern has been formed. Characteristics: the upper boundary 162.85; the lower boundary 162.58; the width of the pattern 27 points
The M5 and M15 time frames may have more false entry points.
Open chart in a new window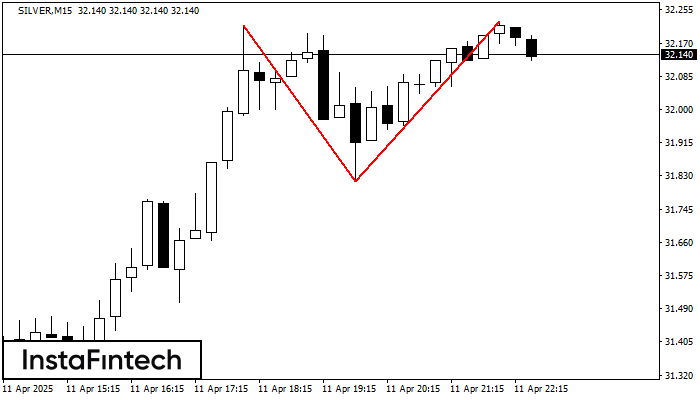
The Double Top reversal pattern has been formed on SILVER M15. Characteristics: the upper boundary 32.22; the lower boundary 31.82; the width of the pattern is 410 points. Sell trades
The M5 and M15 time frames may have more false entry points.
Open chart in a new window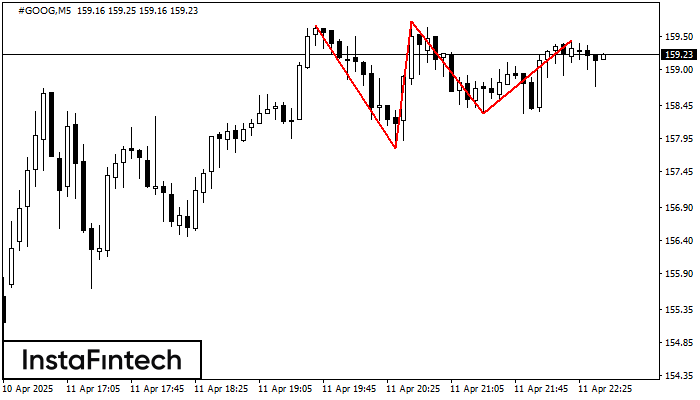
The Triple Top pattern has formed on the chart of the #GOOG M5 trading instrument. It is a reversal pattern featuring the following characteristics: resistance level 23, support level -53
The M5 and M15 time frames may have more false entry points.
Open chart in a new window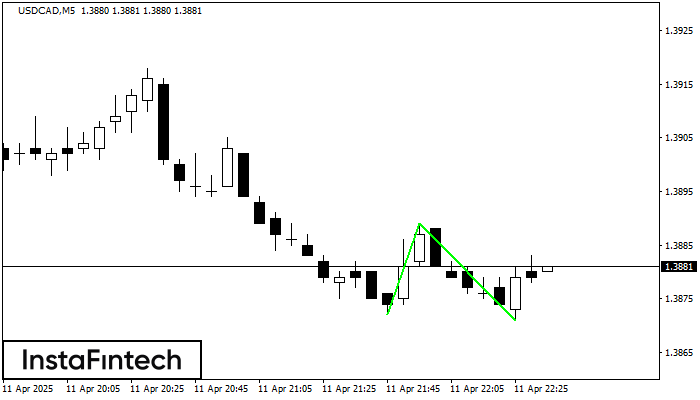
The Double Bottom pattern has been formed on USDCAD M5. Characteristics: the support level 1.3872; the resistance level 1.3889; the width of the pattern 17 points. If the resistance level
The M5 and M15 time frames may have more false entry points.
Open chart in a new window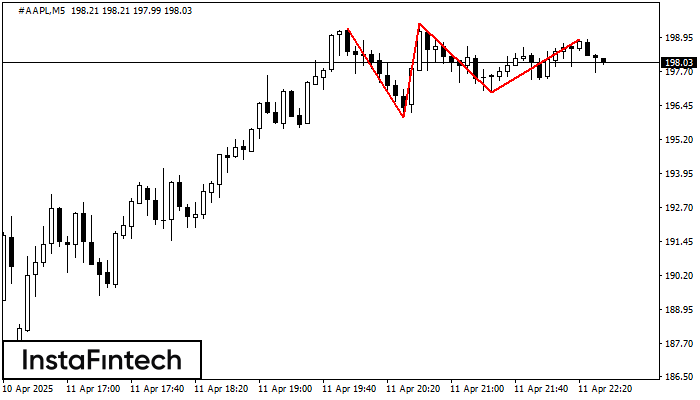
On the chart of the #AAPL M5 trading instrument, the Triple Top pattern that signals a trend change has formed. It is possible that after formation of the third peak
The M5 and M15 time frames may have more false entry points.
Open chart in a new window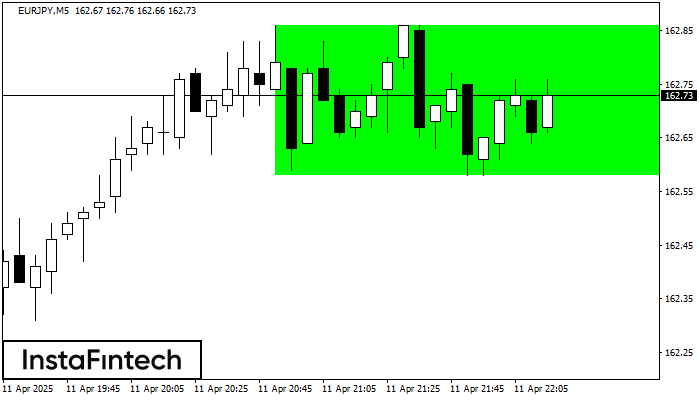
According to the chart of M5, EURJPY formed the Bullish Rectangle which is a pattern of a trend continuation. The pattern is contained within the following borders: the lower border
The M5 and M15 time frames may have more false entry points.
Open chart in a new window