اصل پیٹرن یعنی ایکچوئل پیٹرن
پیٹرن تصویری صورت یعنی گرافکل ماڈلز ہوتے ہیں جو کہ چارٹ میں قیمت کی جانب سے بنتے ہیں جو کہ ٹیکنیکل تجزیات کے امکانات ، ہسٹری {قیمت کے اتار چڑھاو} چونکہ قیمت اپنے آپ کو دہراتی ہے - جس کا مطلب یہ ہے کہ قیمت کا اتار چڑھا یعنی حرکت ایک جیسے حالات میں ہی عموما مختلف ہوتی ہے جو کہ اس بات کو ممکن بناتی ہے قیمت کے مزید رویہ کی پیشن گوئی کی جاسکے جس کا اُسی طرح ہونے کے امکانات خاصے واضح ہوتے ہیں
Actual Patterns
- All
- Double Top
- Flag
- Head and Shoulders
- Pennant
- Rectangle
- Triangle
- Triple top
- All
- #AAPL
- #AMZN
- #Bitcoin
- #EBAY
- #FB
- #GOOG
- #INTC
- #KO
- #MA
- #MCD
- #MSFT
- #NTDOY
- #PEP
- #TSLA
- #TWTR
- AUDCAD
- AUDCHF
- AUDJPY
- AUDUSD
- EURCAD
- EURCHF
- EURGBP
- EURJPY
- EURNZD
- EURRUB
- EURUSD
- GBPAUD
- GBPCHF
- GBPJPY
- GBPUSD
- GOLD
- NZDCAD
- NZDCHF
- NZDJPY
- NZDUSD
- SILVER
- USDCAD
- USDCHF
- USDJPY
- USDRUB
- All
- M5
- M15
- M30
- H1
- D1
- All
- Buy
- Sale
- All
- 1
- 2
- 3
- 4
- 5
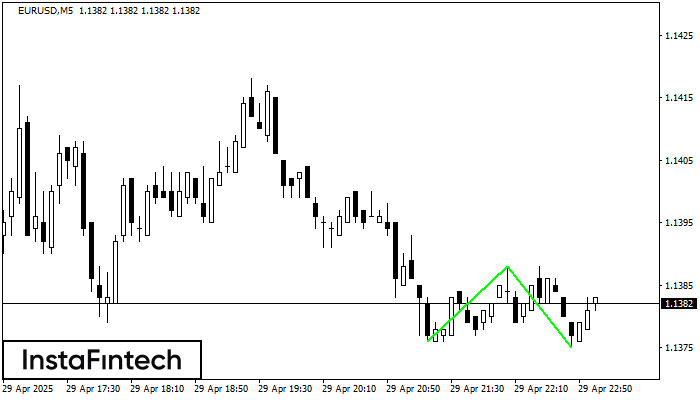
The Double Bottom pattern has been formed on EURUSD M5. This formation signals a reversal of the trend from downwards to upwards. The signal is that a buy trade should
The M5 and M15 time frames may have more false entry points.
Open chart in a new window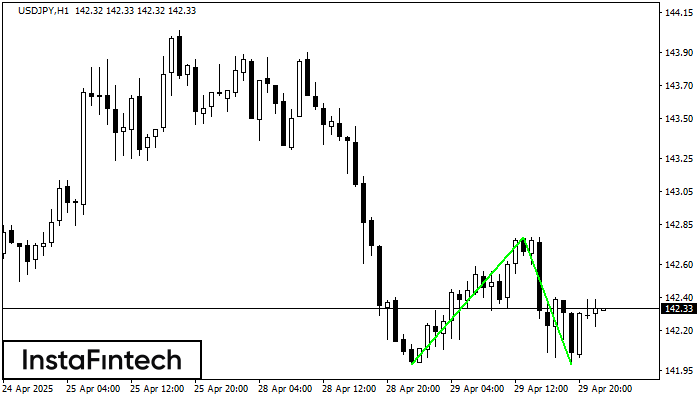
The Double Bottom pattern has been formed on USDJPY H1. Characteristics: the support level 141.99; the resistance level 142.77; the width of the pattern 78 points. If the resistance level
Open chart in a new window
The Double Top reversal pattern has been formed on #PEP M5. Characteristics: the upper boundary 134.35; the lower boundary 133.68; the width of the pattern is 69 points. Sell trades
The M5 and M15 time frames may have more false entry points.
Open chart in a new window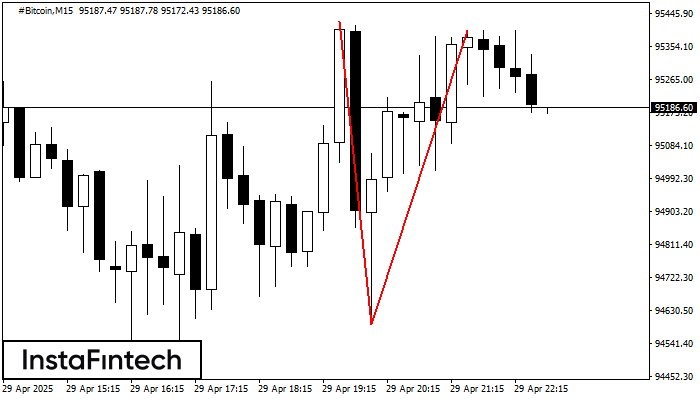
On the chart of #Bitcoin M15 the Double Top reversal pattern has been formed. Characteristics: the upper boundary 95399.01; the lower boundary 94594.52; the width of the pattern 80449 points
The M5 and M15 time frames may have more false entry points.
Open chart in a new window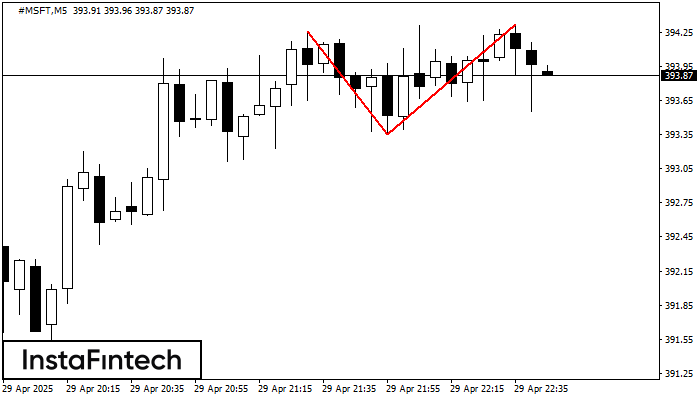
The Double Top pattern has been formed on #MSFT M5. It signals that the trend has been changed from upwards to downwards. Probably, if the base of the pattern 393.35
The M5 and M15 time frames may have more false entry points.
Open chart in a new window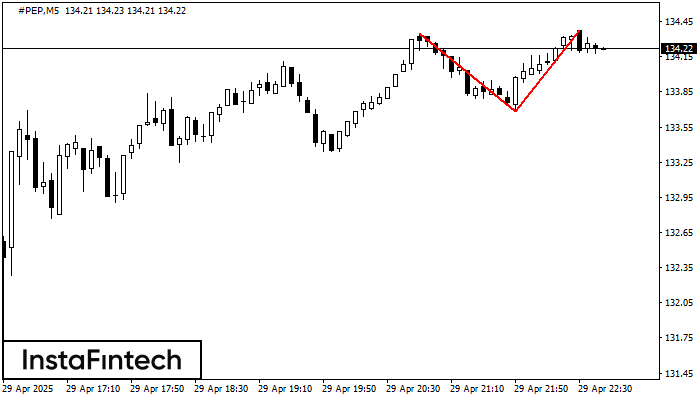
On the chart of #PEP M5 the Double Top reversal pattern has been formed. Characteristics: the upper boundary 134.37; the lower boundary 133.68; the width of the pattern 69 points
The M5 and M15 time frames may have more false entry points.
Open chart in a new window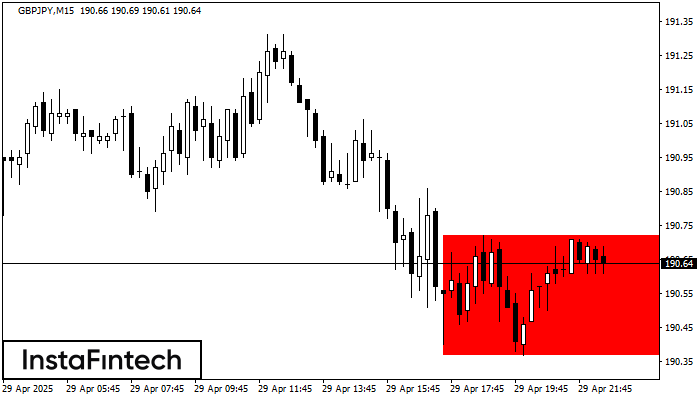
According to the chart of M15, GBPJPY formed the Bearish Rectangle. The pattern indicates a trend continuation. The upper border is 190.72, the lower border is 190.37. The signal means
The M5 and M15 time frames may have more false entry points.
Open chart in a new window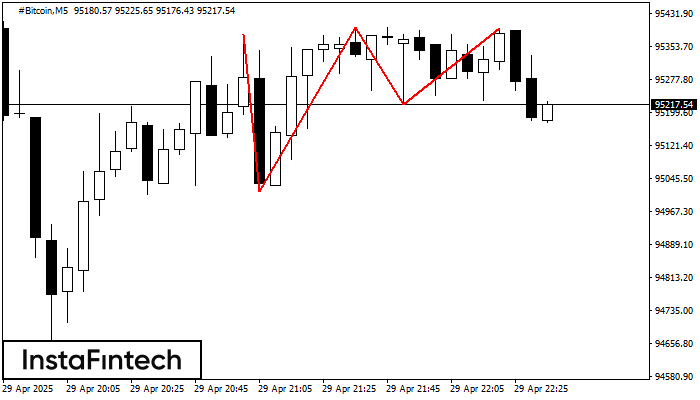
The Triple Top pattern has formed on the chart of the #Bitcoin M5. Features of the pattern: borders have an ascending angle; the lower line of the pattern
The M5 and M15 time frames may have more false entry points.
Open chart in a new window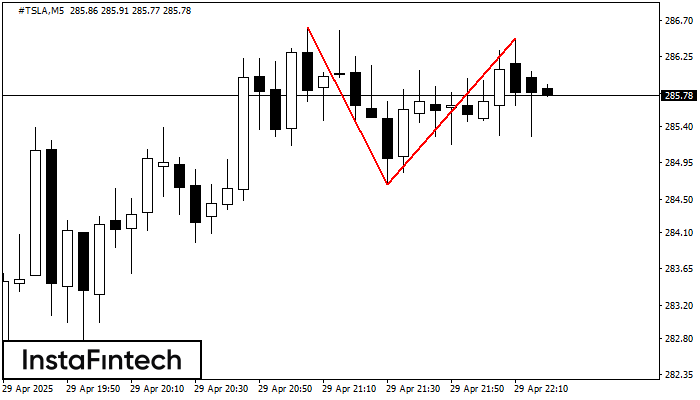
On the chart of #TSLA M5 the Double Top reversal pattern has been formed. Characteristics: the upper boundary 286.48; the lower boundary 284.68; the width of the pattern 180 points
The M5 and M15 time frames may have more false entry points.
Open chart in a new window