empty
02.04.2025 04:49 AM
EUR/USD Forecast for April 2, 2025

By the end of yesterday, the euro fell by 25 pips, but risk appetite in the market continued to grow: the S&P 500 rose 0.38%, the yield on 5-year U.S. government bonds held steady for the third day at 3.95%, and the dollar index posted a symbolic gain of just 0.03%. However, PMI indexes from both the eurozone and the U.S. favored the American economy, and as expected, investors reacted accordingly, mainly ignoring the eurozone's drop in unemployment and inflation figures. The eurozone's Manufacturing PMI rose from 47.6 to 48.6 (below the forecast of 48.7), while the U.S. Manufacturing PMI dropped from 52.7 to 50.2, better than the expected 49.8.

Markets (if you believe the U.S. Democratic media) assume the reciprocal tariffs will harm the U.S. more, as Europe is expected to benefit from increased infrastructure and military spending. However, we do not support this view. Broader infrastructure projects began developing in the U.S. much earlier—during Obama's last presidential term—and in May, a decisive new phase of QE by the U.S. Treasury is set to begin to boost domestic manufacturing. This plan was delayed under Biden, and Trump now intends to compensate for lost time. We believe the real economy, as reflected in the PMI data, remains optimistic. Friday's U.S. employment data for March will carry strategic weight.

This image is no longer relevant

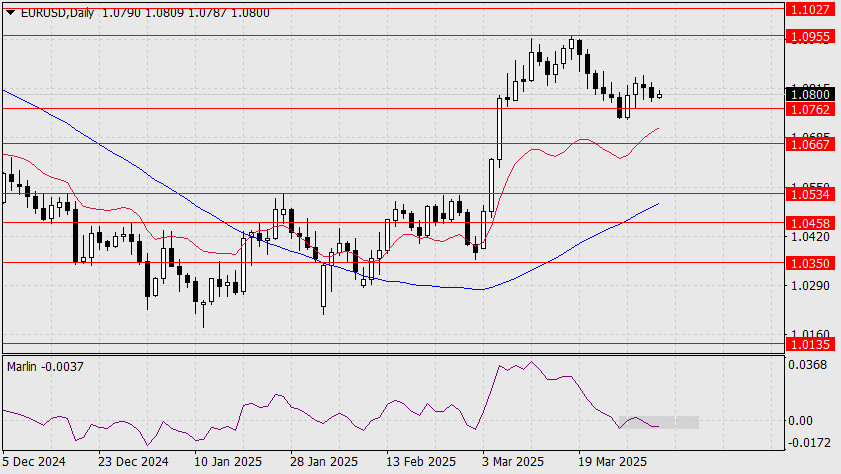
On the daily chart, the signal line of the Marlin oscillator is starting to wind around the zero line. Price may consolidate above the 1.0762 support level. Risk appetite and buying pressure for the euro remain strong, so we maintain our scenario of a rise toward 1.0955 and potentially to 1.1027 as the main outlook. A sustained move below 1.0762 could still push the price down to 1.0667.

This image is no longer relevant

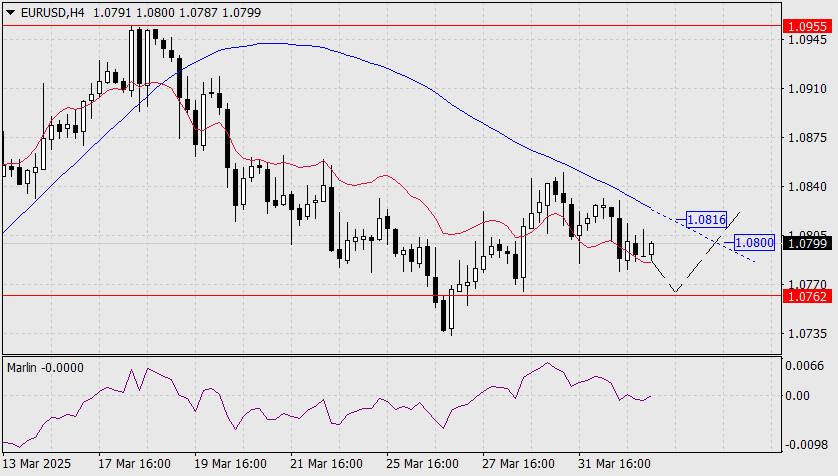
On the H4 chart, the Marlin oscillator is also neutral, while the price is developing above the balance line (red MA). The pair could gradually decline to the 1.0762 support without breaking below the balance line, then rebound and head higher through the MACD line. Whether the rally begins from current levels or a rebound off support, the condition for further growth will be a consolidation above the MACD line. Today, this level is at 1.0816. Tomorrow, it could shift to 1.0800.

Laurie Bailey,
Especialista em análise na InstaForex
© 2007-2025
Selecionar intervalo de tempo
5
min
15
min
30
min
1
hora
4
horas
1
dia
1
s.
Ganhe com as variações das taxas das criptomoedas com a InstaForex.
Baixe o MetaTrader 4 e abra a sua primeira operação.
  • Grand Choice
    Contest by
    InstaForex
    InstaForex always strives to help you
    fulfill your biggest dreams.
    PARTICIPE DO CONCURSO

Recommended Stories

Sinais de negociação para o EUR/USD para 24-26 de abril de 2025: venda abaixo de 1,1435 (SMA 214 - 7/8 de Murray)

Nosso plano de negociação para as próximas horas é aguardar que o euro se recupere até os níveis de resistência próximos de 1,1429 ou 1,1435 para vender, com alvos

Dimitrios Zappas 21:44 2025-04-24 UTC+2

Análise técnica do movimento de preço da prata, quinta-feira, 24 de abril de 2025

No gráfico de 4 horas, o instrumento da commodity prata apresenta sinais de fortalecimento. Esse cenário é confirmado pelo movimento do preço, que está acima da WMA (30, deslocamento 2)

Arief Makmur 17:28 2025-04-24 UTC+2

Análise técnica do movimento de preços do índice Nasdaq 100, quinta-feira, 24 de abril de 2025.

Embora o índice Nasdaq 100 esteja se movimentando lateralmente no gráfico de 4 horas, a faixa de oscilação é relativamente ampla, o que ainda representa uma oportunidade promissora. Atualmente

Arief Makmur 17:25 2025-04-24 UTC+2

OURO: Os preços do ouro podem cair significativamente em um futuro próximo

Os preços do ouro passaram recentemente por uma correção significativa, refletindo as expectativas de que Estados Unidos e China iniciem negociações concretas sobre tarifas e comércio em geral. A declaração

Pati Gani 17:16 2025-04-24 UTC+2

Análise técnica do movimento intradiário de preços do AUD/JPY, quarta-feira, 23 de abril de 2025

Com a presença de uma divergência entre o movimento de preços do par AUD/JPY e o indicador Stochastic Oscillator, além do preço estar acima da média móvel ponderada (WMA)

Arief Makmur 16:00 2025-04-23 UTC+2

Análise técnica do movimento intradiário do preço do ouro, quarta-feira, 23 de abril de 2025

Ao observar o gráfico de 4 horas, o ouro ainda apresenta viés de alta. No entanto, a divergência entre o movimento de preços do ouro e o indicador Stochastic Oscillator

Arief Makmur 15:51 2025-04-23 UTC+2

Análise técnica do movimento intradiário de preços do GBP/CHF, terça-feira, 22 de abril de 2025

Ao analisarmos o gráfico de 4 horas do par cruzado GBP/CHF, observamos diversos elementos interessantes. Primeiramente, o surgimento de um padrão de triângulo, aliado ao movimento

Arief Makmur 15:50 2025-04-22 UTC+2

Análise técnica do movimento intradiário de preços do AUD/CAD, terça-feira, 22 de abril de 2025

Com o par AUD/CAD se movendo acima da média móvel ponderada de 21 períodos (WMA 21), que apresenta inclinação positiva, e com a ocorrência de convergência entre o movimento

Arief Makmur 15:47 2025-04-22 UTC+2

Análise técnica do movimento intradiário de preços do EUR/GBP, segunda-feira, 21 de abril de 2025

Com base no gráfico de 4 horas, o par EUR/GBP parece estar se movendo acima da EMA (100), o que indica que os compradores dominam o par. Assim, no futuro

Arief Makmur 15:36 2025-04-21 UTC+2

Análise técnica do movimento intradiário do USD/JPY, segunda-feira, 21 de abril de 2025.

Com o surgimento da convergência entre o movimento de preço do principal par de moedas USD/JPY, o indicador Oscilador Estocástico e a posição da EMA (100), que está acima

Arief Makmur 15:31 2025-04-21 UTC+2
Não pode falar agora?
Faça sua pergunta no chat.
Widget callback
 

Dear visitor,

Your IP address shows that you are currently located in the USA. If you are a resident of the United States, you are prohibited from using the services of InstaFintech Group including online trading, online transfers, deposit/withdrawal of funds, etc.

If you think you are seeing this message by mistake and your location is not the US, kindly proceed to the website. Otherwise, you must leave the website in order to comply with government restrictions.

Why does your IP address show your location as the USA?

  • - you are using a VPN provided by a hosting company based in the United States;
  • - your IP does not have proper WHOIS records;
  • - an error occurred in the WHOIS geolocation database.

Please confirm whether you are a US resident or not by clicking the relevant button below. If you choose the wrong option, being a US resident, you will not be able to open an account with InstaForex anyway.

We are sorry for any inconvenience caused by this message.