Padrões atuais
Padrões são modelos gráficos que são formados no gráfico pelo preço. Segundo um dos postulados da análise técnica, a história (movimento de preços) se repete. Isso significa que os movimentos de preços geralmente são semelhantes nas mesmas situações, o que possibilita prever o desenvolvimento futuro da situação com alta probabilidade.
Actual Patterns
- All
- Double Top
- Flag
- Head and Shoulders
- Pennant
- Rectangle
- Triangle
- Triple top
- All
- #AAPL
- #AMZN
- #Bitcoin
- #EBAY
- #FB
- #GOOG
- #INTC
- #KO
- #MA
- #MCD
- #MSFT
- #NTDOY
- #PEP
- #TSLA
- #TWTR
- AUDCAD
- AUDCHF
- AUDJPY
- AUDUSD
- EURCAD
- EURCHF
- EURGBP
- EURJPY
- EURNZD
- EURRUB
- EURUSD
- GBPAUD
- GBPCHF
- GBPJPY
- GBPUSD
- GOLD
- NZDCAD
- NZDCHF
- NZDJPY
- NZDUSD
- SILVER
- USDCAD
- USDCHF
- USDJPY
- USDRUB
- All
- M5
- M15
- M30
- H1
- D1
- All
- Buy
- Sale
- All
- 1
- 2
- 3
- 4
- 5
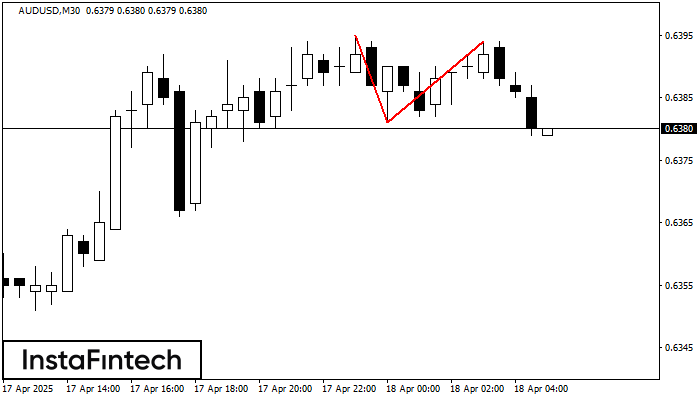
On the chart of AUDUSD M30 the Double Top reversal pattern has been formed. Characteristics: the upper boundary 0.6394; the lower boundary 0.6381; the width of the pattern 13 points
Open chart in a new window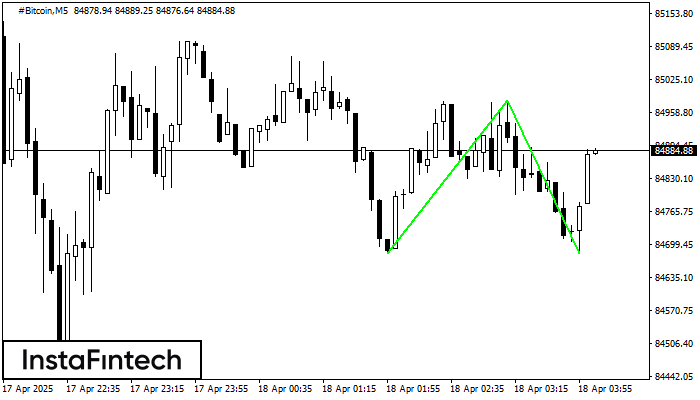
The Double Bottom pattern has been formed on #Bitcoin M5. Characteristics: the support level 84682.60; the resistance level 84984.00; the width of the pattern 30140 points. If the resistance level
The M5 and M15 time frames may have more false entry points.
Open chart in a new window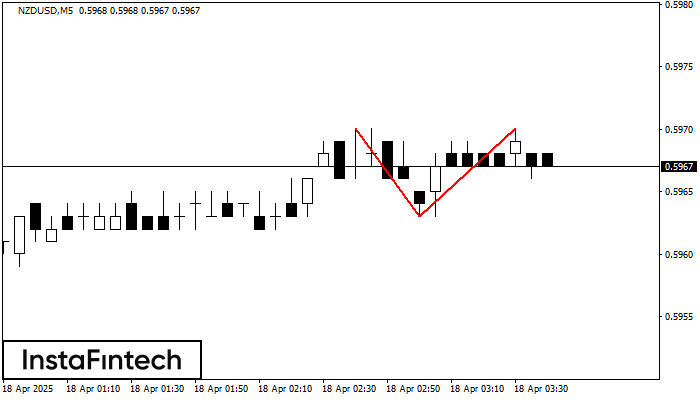
On the chart of NZDUSD M5 the Double Top reversal pattern has been formed. Characteristics: the upper boundary 0.5970; the lower boundary 0.5963; the width of the pattern 7 points
The M5 and M15 time frames may have more false entry points.
Open chart in a new window
On the chart of the GBPUSD M15 trading instrument, the Triple Top pattern that signals a trend change has formed. It is possible that after formation of the third peak
The M5 and M15 time frames may have more false entry points.
Open chart in a new window
According to the chart of M5, EURJPY formed the Bullish Rectangle which is a pattern of a trend continuation. The pattern is contained within the following borders: the lower border
The M5 and M15 time frames may have more false entry points.
Open chart in a new window
According to the chart of M5, EURCAD formed the Bearish Symmetrical Triangle pattern. Trading recommendations: A breach of the lower border 1.5698 is likely to encourage a continuation
The M5 and M15 time frames may have more false entry points.
Open chart in a new window
According to the chart of M5, EURJPY formed the Bullish Symmetrical Triangle pattern. Description: This is the pattern of a trend continuation. 161.95 and 161.75 are the coordinates
The M5 and M15 time frames may have more false entry points.
Open chart in a new window
According to the chart of M5, USDCHF formed the Bearish Symmetrical Triangle pattern. Description: The lower border is 0.8182/0.8188 and upper border is 0.8195/0.8188. The pattern width is measured
The M5 and M15 time frames may have more false entry points.
Open chart in a new window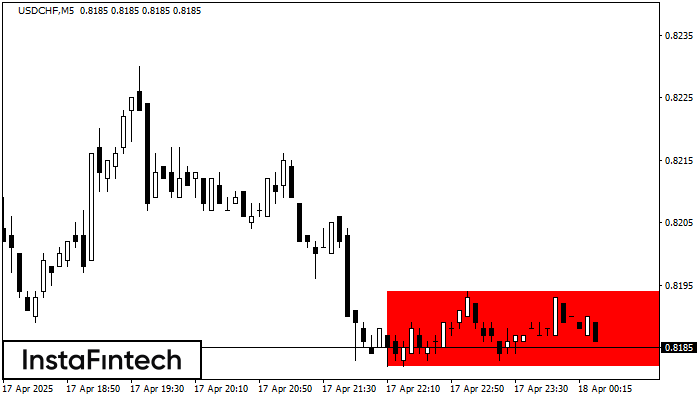
According to the chart of M5, USDCHF formed the Bearish Rectangle. The pattern indicates a trend continuation. The upper border is 0.8194, the lower border is 0.8182. The signal means
The M5 and M15 time frames may have more false entry points.
Open chart in a new window